 1.this is our percentage of females or males that watched our video, this data showed that 10% more of our viewers where female.
 2.this is our age percentage, it showed that 30% of our viewers where aged 15-17, 18-20year olds also had a 30% viewing. However 12-14 year olds, and 21 years plus where 20% of our viewings.
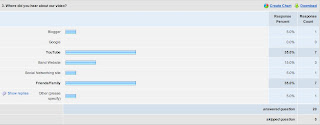 3.this percentage chart showed where people heard about our video from the choices where; blogger, google, youtube, band website, social networking site, friends/family or other. It showed that 35% of our viewers heard about this video from friends/family and 35% heard about the video from youtube.
4.this chart shows us how people rated our music video, there were 5 choices; very poor/hate it, could be better, average/amateur, good and love it. 40% of people loved it, 55% of people said it was good, and 5% said it was average/amateur.
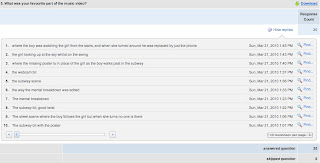
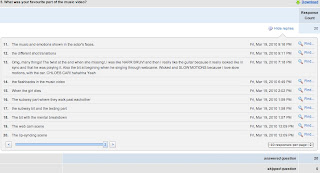
5.these two screen grabs show the twe
nty responses of peoples favorite parts of the video. most popular answers were our webcam scene, and the parts of the mental breakdown.

6.this chart shows wether or not people would change parts of our video, 55% of people said no they would not.

7. this question asked
if people would continue to watch our video, should they see it on a music channel 95% of people said yes.

8. this question asked if they believed a story line helped make the music video more effective in connecting with the audience, 95% of people said yes.
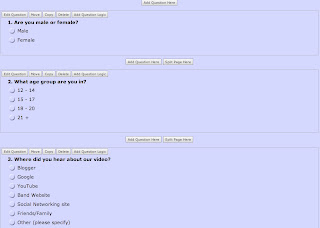
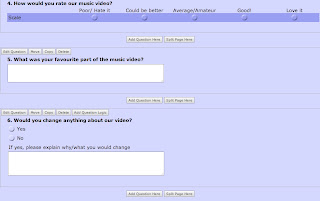
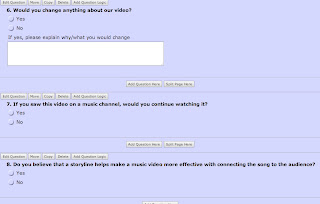
this is a few screen grabs of the questions when we was making the survey;
From my audience feedback i learnt a lot, they told us that they believe we should have used less of ryan lip syncing as there was too much footage, they also told us that they wanted to see more emotion placed into our filming, as this would make the video more believable.
we obtained these results using www.surveymonkey.com
we advertised this survey using the social networking site facebook.
No comments:
Post a Comment